We’ve created templates to help you get the most out of involve.me’s latest integration with Google Sheets and Microsoft Excel Online. The templates are fully customizable reports you can connect to your projects to visualize the data you’ve collected.
These templates help you get the most out of involve.me’s latest integration with Google Sheets and Microsoft Excel Online. They are fully customizable reports you can connect to your projects.
How to Use Google Sheet and Excel Templates
Whether you’re a Google Sheet pro or you’re just starting to figure things out, you’ll be able to use these templates. Just click on a template you like to open it in Google Sheets and under “File”, select “Make a copy”. This will create your own version of the template that you can adjust to your liking.
Each reporting template consists of a Data Input Sheet where data collected from your involve.me projects is automatically sent via the integration. This sheet doesn’t do anything fancy - it’s just there to connect your involve.me project to Google Sheets.
This is the sheet you connect to involve.me. You don’t have to do much else.
The magic happens in the Data Analysis and Data Visualization Sheets. They take information from the Data Input Sheet and make it pretty, actionable and easy to understand.
In order to make the Data Analysis Sheets work, you need to make sure the information is sourced from the right place in the Data Input Sheet. You’ll have to reference the correct rows, columns or specific cells.
Setting it up might take up to 5 minutes, but once everything’s connected, your reports will update automatically every time your involve.me project collects new data.
How to Connect the Templates to involve.me
Like all other native integrations on involve.me, setting everything up only takes 4 clicks.
1. Make a copy of the spreadsheet template you’d like to use.
2. Create your involve.me project or use an existing one. If you’re using an older project you can import old data into the spreadsheet manually so everything’s there.
3. Connect your project to your spreadsheet.
- Go to Integrations and select your project under “Project level”.
- Tick “Use custom integration settings for this project”
- Scroll down the native integrations list until you find Google Sheets.
- Click “Configure”
- Log into your Google account
- Enter a link to the Data Input Sheet
And you’re all set!
Templates You Can Use
1. Comparative Project Metrics Template
This template allows you to pour in data from multiple projects and compare it on an overall or month-to-month basis.
You can use it to see what form generates the most qualified leads or what shoppable quiz brings in the most high-value purchase clients.
It’s based on this Price Quote Calculator, but you can connect it to anything you make in involve.me.
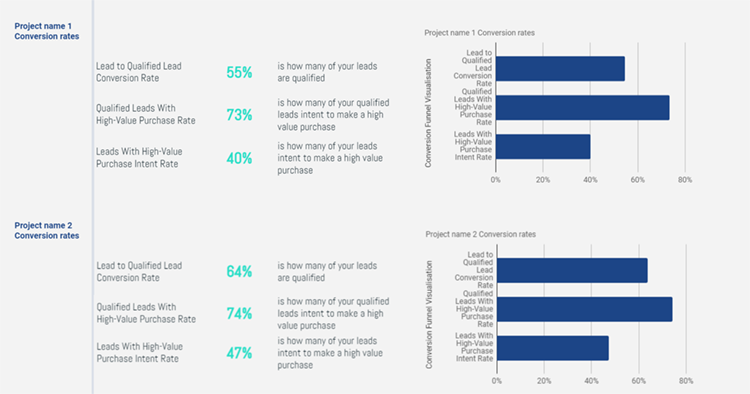
The metrics calculated in this template are:
Lead to qualified lead conversion rate. This means how many of all the leads you collect are actually a good match for your business. The criterion used to identify a qualified lead in this template is how many customers book an in person session. You can change this criterion to be anything that matches your sales cycle.
Qualified lead with high-value purchase rate. For this fictional solar panel roofing business that’s any client who has a roof larger than 100m2 and booked an in person session.
Leads with high-value purchase intent rate. These are clients who did not book an in person session but do have a roof larger than 100m2. Again this metric can be counted on any criteria you use to identify high-value purchase intent, this is just an example.
2. Geo Charts Report Marketing Template
This template measures one guiding metric: your submission’s location.
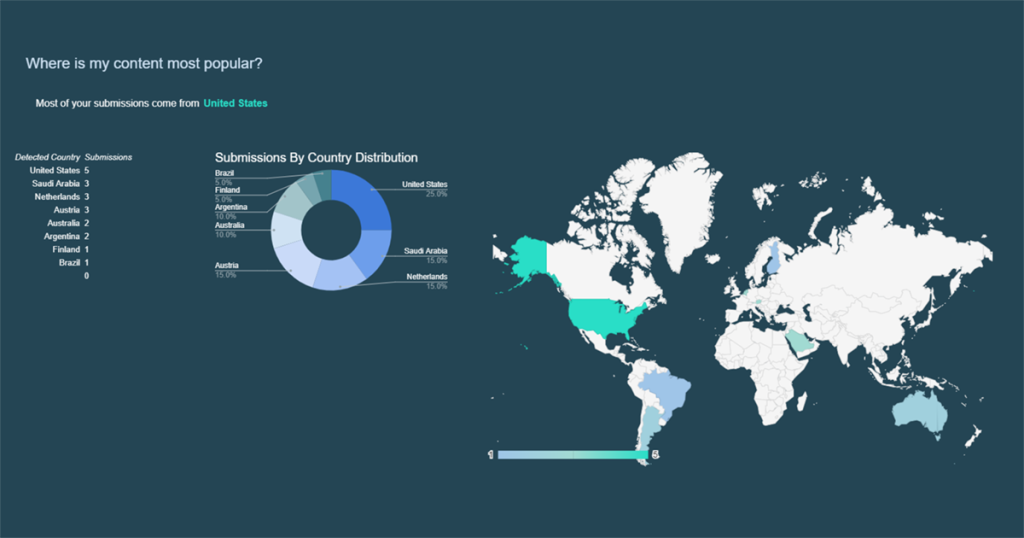
It tracks demographic location data of your involve.me submissions and visualizes it on a map chart and a country distribution chart.
The template used to sync submissions into this sheet was the Headphone Sales Assistant one, but you can connect it to anything you make in involve.me.
When syncing your project into this chart, remember to reference the right data source column in the data source sheet.
This means for example that your project’s location data can be in column N, while the default is synced to column E. Select the right column when connecting this report to your involve.me projects.
3. Classroom Quiz Student Performance Report Template
This spreadsheet report helps teachers keep track of their student’s performance on an individual as well as on a class level.
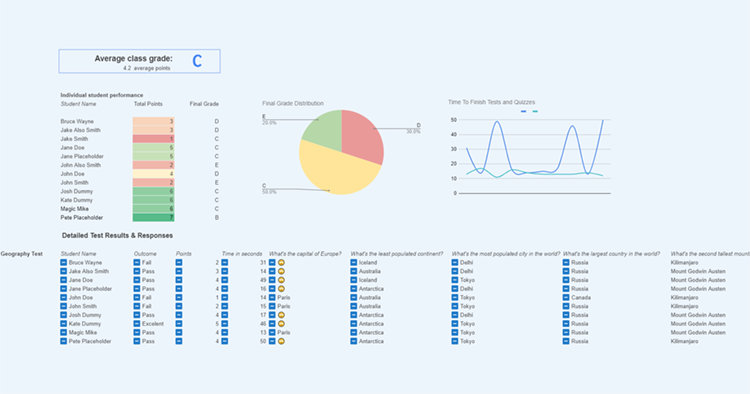
It shows you:
The overall class average grade. You can change the values in the formula that calculates the grade with your own grading scale. A customizable grading scale. You’re in charge of how the grades are calculated. A time to complete the test chart. This shows completion times for all your tests and quizzes and compares the data. All test and quiz answers. So you can see everything in one place.
This report is synced to the Geography Online Test. You can sync as many of your quizzes and online tests into it as you’d like.
How to Customize the Grading Scale
This is the formula that calculates the grades:
=IF(B3=8,"A",IF(B3=7,"B",IF(B3>4,"C",IF(B3>2,"D",IF(B3>1, "E",IF(B3<1, "F"))))))
It seems like a lot, but it’s actually quite simple.
There is a reference cell where the points are taken from: B3
There are point values attributed to grades A, B, C, D, E and F.
By changing these point values, you change the grading scale.
For example, if the student needs to get more than 10 points for an A, this is what the formula for A would look like:
=IF(B3>10,"A")
Since your grading scale has more than one grade, all of the grades are included in a sequence in the formula.
Now that you know how to customize it, you can copy paste the formula from here:
=IF(B3=8,"A",IF(B3=7,"B",IF(B3>4,"C",IF(B3>2,"D",IF(B3>1, "E",IF(B3<1, "F"))))))
Conclusion
These free templates are just a few examples of what you can do with the Google Sheet integration. Of course the content you're making is very specific to your needs that might not be covered by these templates. We hope we inspired you to automate your reporting so that you can get more accurate and clear answers to your business questions.

